

Tom Kim Real Estate Services
Market ReportMay 9, 2026 · By Tom Kim

San Francisco Real Estate Market Report: Spring 2026

Single-family home prices rose 18.3% year-over-year. Condos are moving in 13 days — half the time they took a year ago. AI wealth is reshaping who's buying, and supply can't keep up with any of it. Here's everything you need to know.

San Francisco skyline and neighborhoods

$2.1M

SFH Median Price

+18.3% year-over-year

11 days

SFH Days on Market

Down from 12 last April

125.1%

Avg % of List (SFH)

85.4% sold over asking

−27.6%

SFH Inventory YoY

Only 213 homes for sale

San Francisco's spring 2026 market arrived with conviction. After years of recovery from pandemic-era declines, the data coming out of April is unambiguous: this is a seller's market with real urgency behind it. Inventory is near historic lows. Prices are up sharply year-over-year. And the listings that are hitting the market aren't sitting — they're generating multiple offers, often within days.

The catalyst is well-documented at this point: AI. The concentration of artificial intelligence companies in San Francisco — Anthropic, OpenAI, and dozens of well-funded startups — has created a new class of buyer with compensation packages that would have seemed implausible two years ago. Reports of $500,000 signing bonuses for 22-year-old engineers aren't outliers. They're becoming the floor.

What makes this market particularly difficult for buyers is the supply side. Sellers who might have listed a year ago are holding — because they've heard the market keeps improving, and in many cases they're right. The result is a city where demand is surging and inventory is down nearly 28% for single-family homes and 29% for condos compared to last April. That math is brutal for anyone trying to buy.

What follows is a full breakdown of the April 2026 data from Vanguard Properties' May 2026 Market Update, with neighborhood-level detail and the context you need to make sense of it.

The most competitive segment in the city

Single-family homes in San Francisco are selling faster and for more money than at any point in recent memory. The April 2026 median sale price of $2,105,000 represents an 18.3% increase over April 2025 — a gain of more than $325,000 in twelve months. The median price per square foot climbed 11.3% to $1,188. And homes are selling in a median of 11 days, down from 12 a year ago.

The overbid figures tell the fuller story. Sellers received 125.1% of list price on average — up from 114.3% the prior April. 85.4% of single-family homes sold over asking, compared to 77.8% a year ago. Closed sales were up 9.8%, a meaningful gain in the context of inventory that fell 27.6% year-over-year. There were only 213 single-family homes for sale city-wide at the end of April.

The competition for well-positioned listings is fierce in a way that extends beyond the headline numbers. Many properties are trading in "Coming Soon" status before they ever appear on the open market, which means the effective inventory available to unprepared buyers is even lower than the official count.

April 2026 vs. April 2025 — Single-Family Homes

Median Sale Price
$2,105,000+18.3%
Median $/Sq Ft
$1,188+11.3%
Days on Market
11 days−8.3%
Homes for Sale (EOM)
213−27.6%
Went Into Contract
234+6.4%
Properties Sold
247+9.8%
% Sold Over List
85.4%vs. 77.8%
Avg % of List Received
125.1%vs. 114.3%

The condo market's biggest turn in years

If there's one market segment that defines the spring 2026 story, it's condos. After years of sluggish recovery — during which remote work crushed urban condo demand while single-family homes surged — the condo market has snapped back sharply. The numbers are striking in both their magnitude and their speed.

The April 2026 median condo sale price of $1,377,500 represents a 17.5% year-over-year gain. Closed sales rose 24.8% — the biggest volume increase of any segment. Pending sales were up 17.9%. And days on market collapsed from 28 to just 13, a 53.6% improvement. That is a wholesale shift in buyer behavior, not a seasonal blip.

The overbid transformation is equally dramatic. In April 2025, 34.9% of condos sold over asking. In April 2026, that figure was 57.7% — a 65.3% increase. The average price received climbed from 101.9% to 108.5% of list. Inventory fell 29.0% to 529 units city-wide, compressing the options available to buyers.

For buyers who were waiting on the sidelines while the condo market recovered: the wait is over. The window of relative value that existed in 2024 and early 2025 has largely closed.

April 2026 vs. April 2025 — Condominiums / TIC / Co-ops

Median Sale Price
$1,377,500+17.5%
Median $/Sq Ft
$1,124+8.8%
Days on Market
13 days−53.6%
Homes for Sale (EOM)
529−29.0%
Went Into Contract
277+17.9%
Properties Sold
272+24.8%
% Sold Over List
57.7%vs. 34.9%
Avg % of List Received
108.5%vs. 101.9%

AI wealth, tight supply, and rates that finally cooperated

Three forces are converging to create the current market: a surge in high-income buyers driven by AI compensation, structurally low supply, and mortgage rates that have pulled back from their 2023–2024 peaks.

The AI demand story is now well-established. The concentration of Anthropic, OpenAI, and a deep bench of well-capitalized AI startups in San Francisco has created a buyer cohort with purchasing power unlike anything the city has seen since the peak of the 2021 tech boom — and arguably more concentrated. TechCrunch has described the current moment as the SF housing market having "lost its mind," with homes regularly selling for $1 million over asking. Reports of 20-offer scenarios on quality listings in desirable neighborhoods are common.

The supply problem is structural and self-reinforcing. Many would-be sellers are holding because they've watched the market improve and expect it to continue. Zoning constraints and slow permitting limit new construction. With only 213 single-family homes for sale city-wide at the end of April — in a city of approximately 900,000 people — supply has essentially no ability to absorb the incoming demand wave.

The result is what Fortune has characterized as "a tale of two markets": luxury home sales up 22% year-over-year, non-luxury sales up just 3.8%. The AI boom is not lifting all boats equally — but for the neighborhoods and price points where Tom focuses, the demand is unmistakably real.
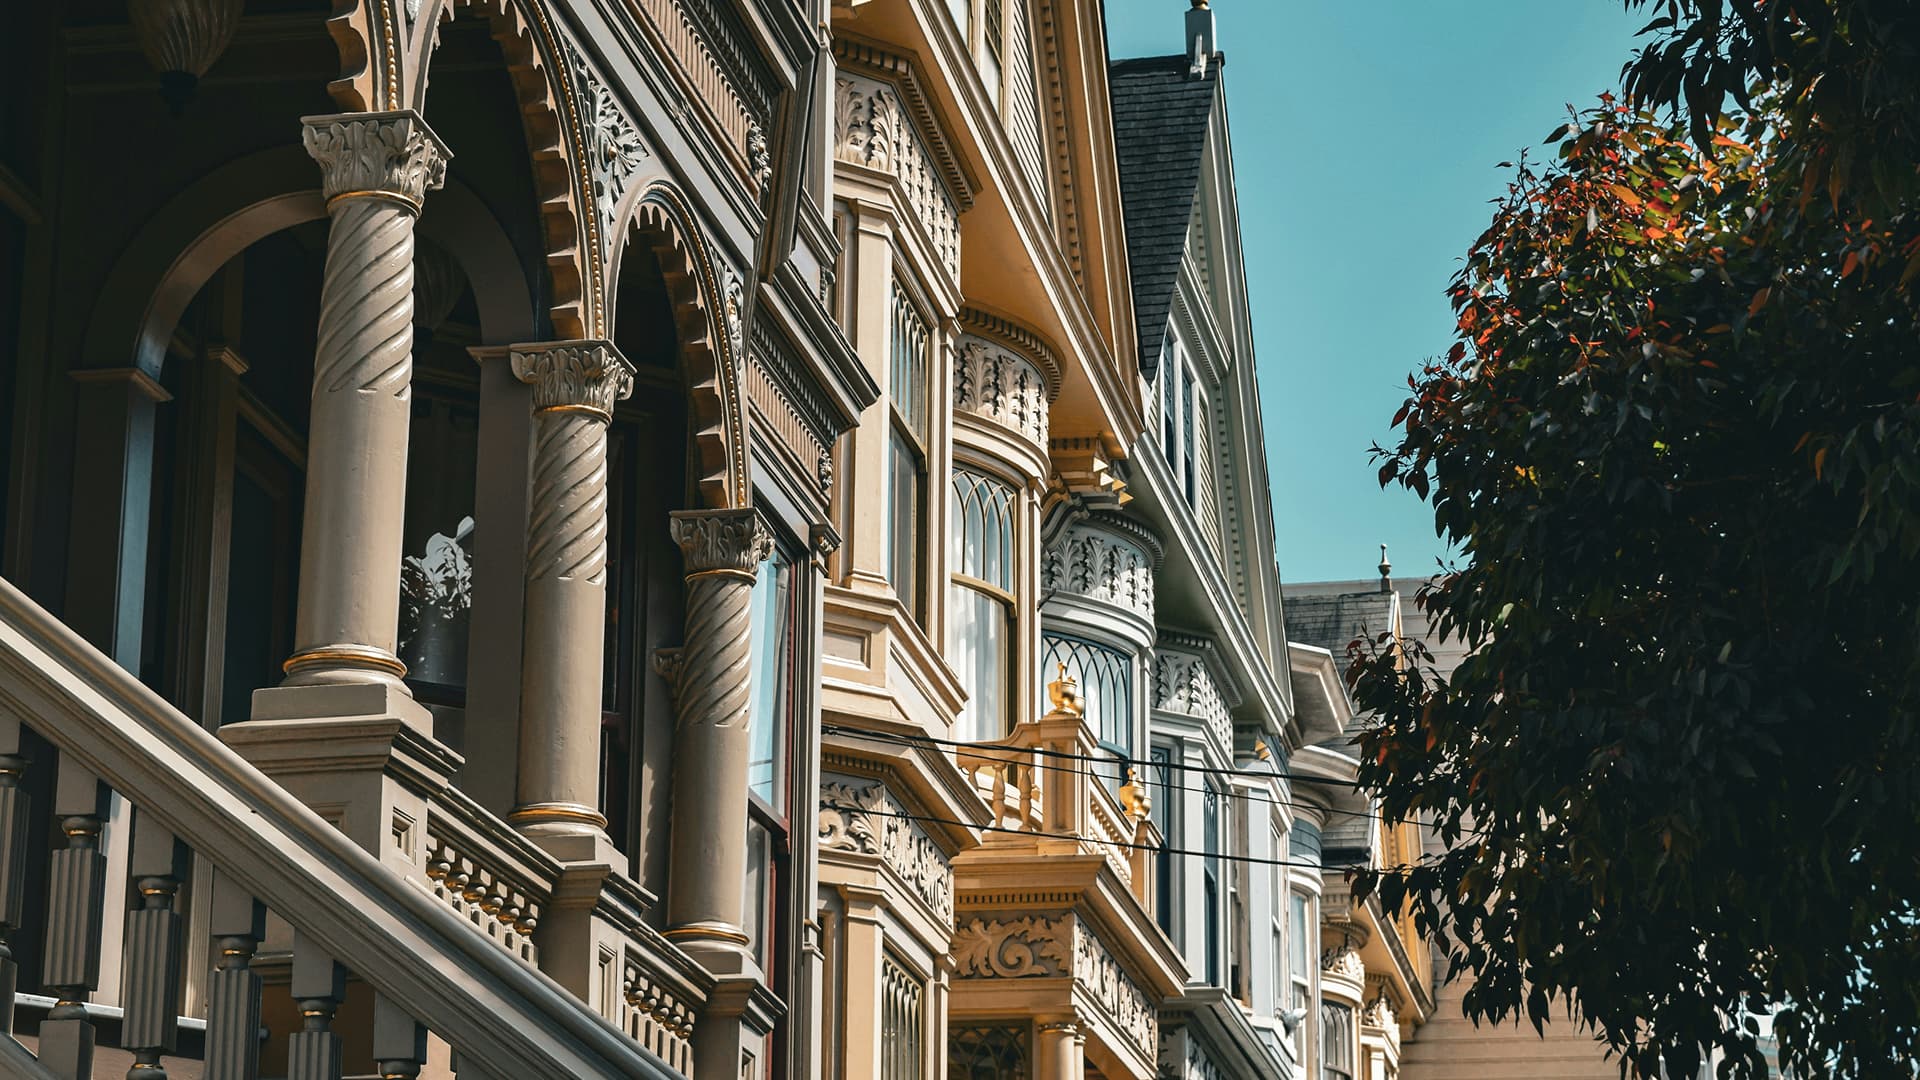

San Francisco neighborhood street scene

Every SF neighborhood — Q1 2026 data

The city-wide medians mask significant variation neighborhood-to-neighborhood. Here's the full picture from Vanguard Properties' Q1 2026 data.

Single-Family Homes

NeighborhoodMedian% of List
Pacific / Presidio Heights$8,300,000103.1%
Hayes Valley$5,650,000128.0%
Marina / Cow Hollow$5,200,000108.3%
Russian Hill$4,100,000100.0%
Cole Valley / Haight$3,900,734114.8%
Buena Vista / Corona Heights$3,650,000115.6%
Castro / Duboce Triangle$3,600,000132.7%
Lower Pacific / Laurel Heights$3,525,000109.1%
Noe Valley$3,412,500125.7%
Diamond Heights$3,350,000138.3%
Richmond / Lake Street$2,575,004119.0%
Ingleside Terrace / Lakeside$2,556,000112.2%
Sunset$1,900,000129.6%
Bernal Heights / Glen Park$1,730,000120.7%
Westwood Park / Sunnyside$1,680,000118.2%
Alamo Square / NOPA$1,653,325113.2%
Potrero Hill$1,650,000118.2%
Mission$1,530,000114.0%
Excelsior / Portola$1,250,000115.4%
Bayview / Hunters Point$1,050,000110.6%

★ Tom Kim's primary focus neighborhoods · Source: Vanguard Properties May 2026 Market Update · SFAR MLS & BrokerMetrics · Q1 2026

Condominiums, TICs & Co-ops

NeighborhoodMedian% of List
Pacific / Presidio Heights$1,900,000112.2%
Cole Valley / Haight$1,815,000117.0%
Buena Vista / Corona Heights$1,800,000113.0%
Richmond / Lake St$1,697,500111.6%
Noe Valley$1,675,000112.4%
Castro / Duboce Triangle$1,575,000108.3%
Mission Dolores$1,550,000114.8%
Mission Bay$1,530,000102.4%
Alamo Square / NOPA$1,405,000111.8%
Russian Hill$1,392,500103.2%
Marina / Cow Hollow$1,355,745108.7%
Lower Pacific / Laurel Heights$1,225,000104.0%
Nob Hill$1,205,000100.8%
South Beach / Yerba Buena$1,195,00098.4%
Potrero Hill$1,141,500103.7%
Hayes Valley$1,105,000108.6%
Mission$1,100,000105.5%
Bernal Heights / Glen Park$867,500109.4%
Dogpatch$846,000106.5%
Bayview / Hunters Point$750,000101.5%
SOMA$705,00097.5%
Diamond Heights$640,00098.4%

★ Tom Kim's primary focus neighborhoods · Source: Vanguard Properties May 2026 Market Update · SFAR MLS & BrokerMetrics · Q1 2026

Preparation has always mattered. Right now it's everything.

With 85.4% of single-family homes selling over asking and the average buyer paying 125.1% of list, the math on being unprepared is severe. You're not just losing on price — you're losing to buyers who've done the work before you have.

The practical checklist: pre-approval in hand before you start touring, a clear sense of what TIC vs. condo vs. SFH means for your financing, and a realistic budget that accounts for the spread between list price and likely close price. Many listings in the Castro, Noe Valley, and Sunset are attracting 10–20 offers. Showing up ready to compete is table stakes.

One real advantage available to buyers right now: the inventory shortage means a significant number of desirable properties are trading before they hit Zillow. An agent with deep neighborhood relationships — who knows what's coming to market before it does — is worth meaningfully more in this environment than in a normal market.

Start the Conversation →

The demand is exceptional. The preparation gap is real.

If you own a single-family home in the Castro, Noe Valley, Glen Park, Bernal Heights, or the Sunset, the April 2026 data is working in your favor. These are segments where sellers are routinely receiving 115–133% of list price and closing without concessions.

But "the market is strong" and "your listing will perform well" are not the same statement. Buyers in this price range are sophisticated — they recognize deferred maintenance, they study disclosures carefully, and they know what competing properties look like because they've toured them all. The spread between a well-prepared listing and an unprepared one in this market can easily be $200,000–$400,000 on a property in the $2–3.5M range.

The right time to start thinking about a sale is 60–90 days before you want to list. That's the window for pre-listing work, staging decisions, and pricing strategy that directly affects your outcome.

Request a Home Valuation →

What I'm telling clients right now.

I've lived and worked in the Castro and Duboce Triangle for years, and this spring feels different. The demand isn't theoretical — I'm watching it happen at open houses and offer presentations. Properties that would have taken 60 days to sell in 2023 are going in a week with multiple offers above list.

For buyers: the instinct to "wait and see" is understandable, but the data doesn't support it. Inventory is down nearly 28%. Prices are up 18%. Waiting for the market to soften while AI companies are signing tens of thousands of new employees in this city is a bet I wouldn't take. The better move is to get prepared, get pre-approved, and move decisively when the right property appears.

For sellers: if you own a well-maintained property in a neighborhood with strong demand, the window right now is exceptional. But "exceptional market" doesn't mean you can skip preparation. Every dollar you put into pre-listing work and strategic pricing tends to come back multiplied in this environment.

Either way — the conversation is free. I'm happy to walk through what the numbers mean for your specific situation.

Tom Kim, San Francisco Realtor

Sources

All MLS data sourced from SFAR MLS & BrokerMetrics via Vanguard Properties. Property types covered: Single-family, Condominiums, Loft condominiums, TIC, and Stock COOP. All information is deemed reliable but not guaranteed for accuracy. Data subject to errors, omissions, and revisions. ©2026 Vanguard Properties. Equal Housing Opportunity. DRE No. 01486075.